I grew up admiring and appreciating NFL Hall of Fame quarterback, Roger Staubach. But I didn’t like him. He had this uncanny ability to beat my St. Louis Cardinals when they were down with just minutes to play.
I’m not the only person who believes Staubach was a king of clutch. According to Bleacher Reports, Staubach led his Cowboys to 15 fourth quarter comebacks and 23 game-winning drives (typically after the 2-minute warning). It just seems like all of those rallies were against my favorite team (the one that wound up in Arizona).
Mr. 2-minute drill got me thinking about financial statements. What could one of your clients learn about financials in 2 minutes? How about before you were their CFO and then about six months after you joined the team?
It’s time to play a 2-minute drill. Ready?
Rules for the 2-Minute Financial Statement Drill
Here’s the game we’re going to play. I’m going to give you a link to a company’s financial statements. You can look at this year’s income statement compared to prior year’s. You can do the same for the balance sheets and the cash flow statements. No more–that’s it.
We’re just looking at financial statements, no metrics. You can use any tools you want including a spreadsheet.
I will tell you that this company is a hardwood floor retailer with some 170 locations. Again, you have two minutes, and that’s all.
When your time is up, take a couple more minutes to write down any questions you might have. For example, what might you want to know more about this particular company?
Here’s the link to the file.
My Analysis
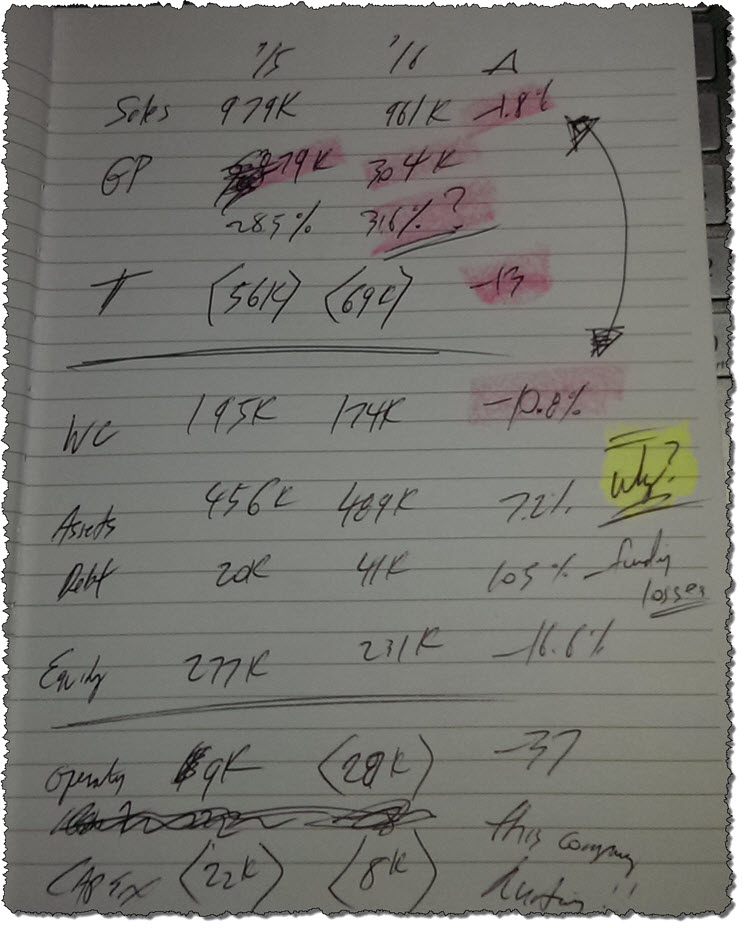
How did you do? Here’s what I scribbled, and I used Excel to help with some math.
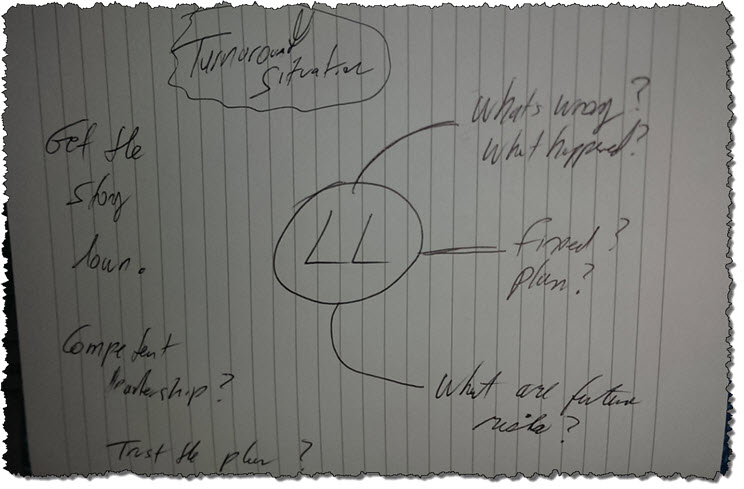
On another page, I also added some notes for follow-up:
Sorry, my sketching is ugly and hard to read–I was scribbling fast.
What did you focus on? Where did you start? Where did you end?
If you had a new client do this, how would they have done? How about a client you’ve had for a while?
My 2-Minute Drill Thought Process
We have an unfair advantage since we’ve been doing this for years. We don’t even think about it–we just do it. For the sake of providing an educational framework that you can teach your clients, here’s how I tackled the 2-minute drill:
Sales Growth | I usually start with the P&L first unless it’s a real estate business. What is the sales growth year-over-year? I wish I had more to go on, but this is the starting point. For Lumber Liquidators, sales dropped 1.8%. Find out why later. Was this expected? Bad management? Other?
Gross Margin | For a retailer, this is one of several key numbers. Gross margin jumped from 29.5% to 31.6%. That’s huge. Why? Accounting adjustments? Better buying? Change in mix?
After-Tax Earnings and Margin | The company lost $56 million last year and $69 million in the current year. So what’s happening? Is this fixable? When a company is making money, I want to know pre- and after-tax earnings as a percentage of revenues. Unfortunately, I picked a company that’s losing money. If I had chosen a company with earnings in the black, we would have been looking at earnings margins of say, 6.1% compared to 6.5%. Pre-tax and after-tax margins typically don’t move that much.
Working Capital | Since I had limited data points, I compared year-over-year growth in working capital versus looking at the components of working capital (receivables, inventory, and payables). Remember, we only had two minutes. We want to see working capital moving in the same direction as sales. As sales dropped 1.8%, working capital decreased 10.8%. Working capital to sales was 20% and 18% for 2015 and 2016, respectively. Is this good? Bad? We need more information. At least we have a starting point.
Total Assets | I mainly care about growth and at what rate. In our case, total assets grew 7.2% while working capital dropped. So this tells us this hurting company is still investing in its asset base or investment for the future. It’s at this point I wish I knew what management was thinking–what’s the go-forward plan?
Debt | Is debt going up or down? Losses are either funded by prior-period excess cash levels, owner equity injections, or increases in debt. In this case, debt increased from $20 million to $41 million. Is it enough? Or, is the debt too high to service each month?
Equity | When a company is making money, I compare retained earnings to total assets as a percentage. That percentage gives me insights on whether the shareholders are pulling too much money out of the company in the form of dividends and distributions. In our distressed company, equity dropped nearly 17% or $46 million. I did not provide you the equity roll forward reporting page. For now, this will have to do.
Operating Cash Flow | For companies in the black, I compare operating cash flow to earnings. This is key. You know it, I know it, but our CEOs typically don’t. By looking at working capital earlier, there should be few surprises once we get to this line item. When the company is growing, this number usually takes a hit and has to be funded by increases in the line of credit. In our 2-minute drill, we learned that operating cash flow was a positive $9 million in 2015 and a negative $28 million in 2016. During both years, cash-basis earnings were higher than GAAP earnings.
Capital Expenditures | The company spent $22 million in fixed assets in 2015 and another $8 million in 2016. What we don’t know is if this is maintenance CapEx or investment CapEx. Without looking at the note disclosures, I have no idea if this retailer was adding stores during this two-year period. In the small business reporting world, my goal is to get a handle on maintenance CapEx as quickly as possible, especially for manufacturing companies. Over any trailing 3-year period, maintenance CapEx as a percentage of sales should be consistent. Once our clients get this simple concept nailed down, they’ll never entertain the idea of using EBITDA in their financial reporting vernacular again. And that’s a good segue to one of the most important trailing-12 month key numbers for any company of any size.
Free Cash Flow | This is my all-important number. But for LL, their free cash flow is negative both periods–$13 million and $36 million, respectively. When I’m helping my clients to plan future years, I start with this number. Then we start working backward until we have a P&L we believe that is bankable and achievable. Then we go forward by examing how much has to go to Uncle Sam, how much we can apply toward debt, and how much we want to give back to the owner. In the case of LL, they have to figure out how to remain solvent.
For this blog post, below are the critical numbers in Excel format that I pulled from my notes:
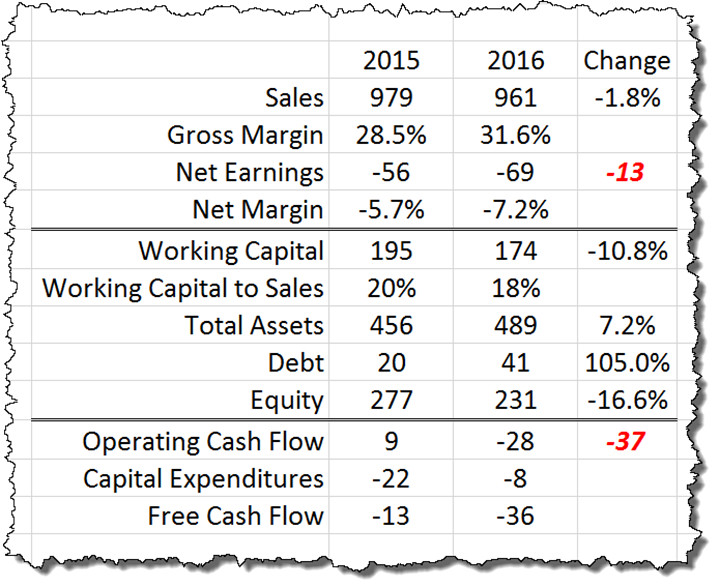
The 2-Minute Drill, So What?
I’m sharing the concept of the 2-minute drill because it’s a tweak on how I educate potential clients when we’re meeting for the first time. Our time is short, so hitting just a small handful of numbers yields several insights on where the priorities need to be.
The numbers don’t tell the story, just quantify the storyline. This exercise will determine if we’ll be the mentor on the CEO’s hero’s journey.
Have some fun with this drill as there are several ways this can be applied to your client relationships.
Good Luck to Lumber Liquidators
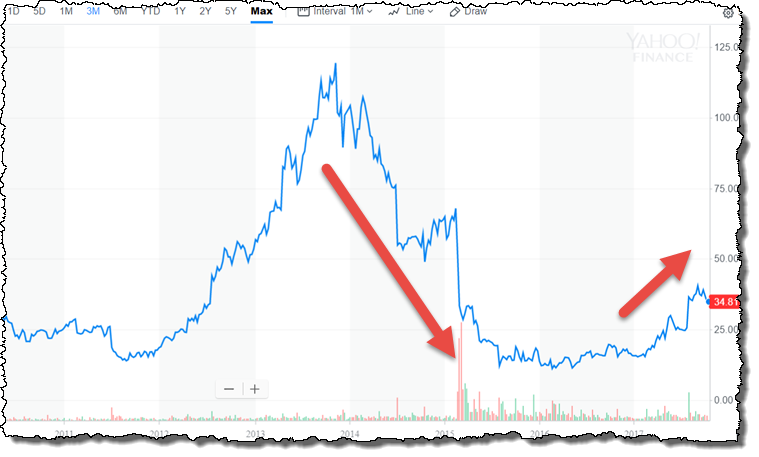
So what happened to Lumber Liquidators (LL)? Lawsuits rocked the brand in 2014 and 2015. That’s why the numbers in the 2-minute drill were abysmal.
The stock started rebounding during 2016. Will success continue? Here’s one article to read if you want to learn more from Seeking Alpha.
Hey Mark, I always enjoy reading your posts. The two minute drill was an interesting exercise.
Thanks, Patrick.
And back at you. I just found your website–keep writing!!