A funny thing happened at the office of my first couple of clients (er, more like most of them).
Mark: “The first thing I’d like to do is look at your sales data.”
Karen Client: “Sales, what?”
Mark: “Uhhhhhhh, sales, uhhh, sales information. Where can I get sales information by client, by rep, and, you know, so on.”
Karen Client: “Oh, that! I can get Bill to help you with that. Is tomorrow fine? Or Friday? He’s busy with payroll this week. That’s interesting that you ask. I can’t wait to see what you’ll do with that data.”
Mark: “Sure Karen. Where’d you say that coffee was?”
Okay, I’m taking some Hollywood-like liberties here, but most small business owners do not do any type of sales analysis. Yet, the basics can make a huge difference.
The Sales Rollforward–The MacGyver-like Secret Weapon for Every Part-time CFO
Many of us endured at least a few years of public accounting. Once we learned how to work the photocopying machines of the 1980s and figure out where to pick up the box of tickmarks for our managers (I never fell for that one), we were allowed to audit cash.
By month 3 or 4, we graduated to fixed assets and long-term debt. Golly-blimey, I was feeling special. And remember those rollforward workpapers we created on the 16-column worksheets? You know, the kind where we created the rollforward in 4 columns and carefully copied last year’s workpapers in the other 12 only to have our documentation ripped to shreds by the in-charge, manager, and partner?
Flash forward some 10-plus years. Why not use the rollforward concept with sales analysis? And that’s exactly what I do for every B2B organization I work with. And the response is the same. “Mark, this is great stuff.” And then, “Let’s dive deeper.” Remember, these are the same folks who were flying in the dark before they met us.
What the Sales Rollforward Looks Like
I don’t want to know that sales just went up 3%, or 5%, or whatever that growth rate or drop is. Tell me why as well. If sales went up just 2%, there have to be some good stories in that number. Some bad ones too.
Let’s exploit the good and minimize the bad by examining a sales rollforward that looks something like this:
Before we move on, this is not a how-to discussion. You guys are way beyond me cognitively anyway. Instead, this is about what, not how. Accordingly, use this as brainstorming material for current and new clients.
Step One, Prep the Data
This is the fun part and where you start pulling your hair out if you have any left. If your client has QuickBooks, don’t hold your breath as they might be generating invoices in another billing system. Try running a sales summary report for the past 12 months and click the option for prior-year data. Then export to Excel.
If it’s early in the calendar year, I dump out the trailing-12 month sales data and then compare to the same 12 months a year earlier. If we’re more than 6 months into the new calendar year, then I’ll also compare year-to-date to prior-year-to-date sales.
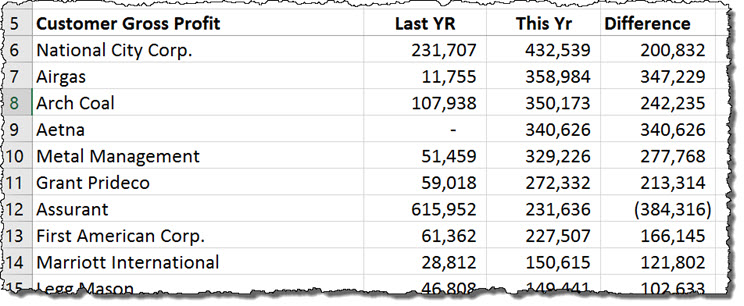
The goal is to start getting your columns set up similar to what I have below. In short, you want columns for the customer, this-and last-year sales, and then pop in the difference/variance column.
Congratulations. The above is the tedious part. The rest is downhill from here.
Step 2, Add a Critical 5th Column
You can do this manually or create a simple macro. Should you create the macro, you’ll probably be able to populate the worksheet manually much faster than by creating the code to automate the worksheet. If you recycle this tool monthly or quarterly like I do, then do the macro.
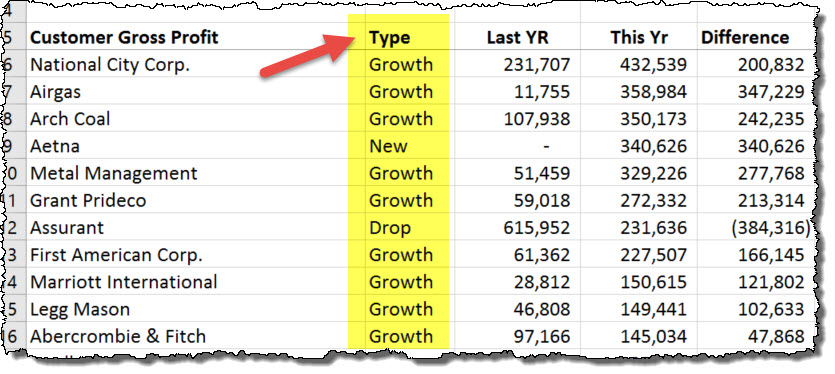
This is the critical column allowing us to do our sales rollforward. You can call the column heading anything you like. You’ll populate each customer with either:
- Growth (for growth in sales)
- New (as in new customer sales)
- Drop (as in drop in sales)
- Lost (as in lost customer sales)
I happened to name that new, fifth column, Type. Below is what your newly-created sales report should now look like. By the way, mine has over 230 rows in it:
This new column explaining the sales behavior for each customer becomes our secret sauce and a powerful analytical tool that I’ll explain later.
Step 3, Basic Excel Housekeeping – Header Totals and Filtering
I can be a persnickety grouch at times, especially when an accountant or analyst gives me a long Excel report where the totals are at the end of the list, some 1,000 rows deep.
My first reaction is to buy and give them Steve Krug’s book, Don’t Make Me Think, which needs an Excel version called Don’t Make Me Work.
Please, raised to the power of 10, put your totals at the very top. Then add the filter to your list.
Here’s your short Excel housekeeping list with the image below:
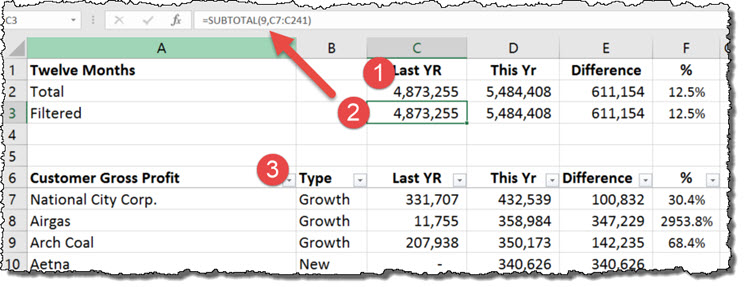
- Add a grand total with the header in Row 1, then the totals right below in Row 2.
- Since we’ll be filtering the table, add a second row-total row but use the subtotal function.
- Apply the Filter to to your table.
If we stopped right here, we’d have an incredible tool with great insights for you and your client. Very quickly, we can see who our our top customers are by sorting the table. We can sort the sales variance from high to low, or low to high. Or we can filter our data by Type, our new column.
When you show this to your client the first time, their jaw will drop (you’ll tempted to put it back, but don’t do that). Then they’ll say, “Email that to me.”
Step 4, Create the Sales Rollforward
It’s time now to earn our stripes. If you think you already have, say what? Here in Free Agent CFO™ Nation, we don’t go the extra mile, we go the extra 10, 15, 20 and beyond, and then some.
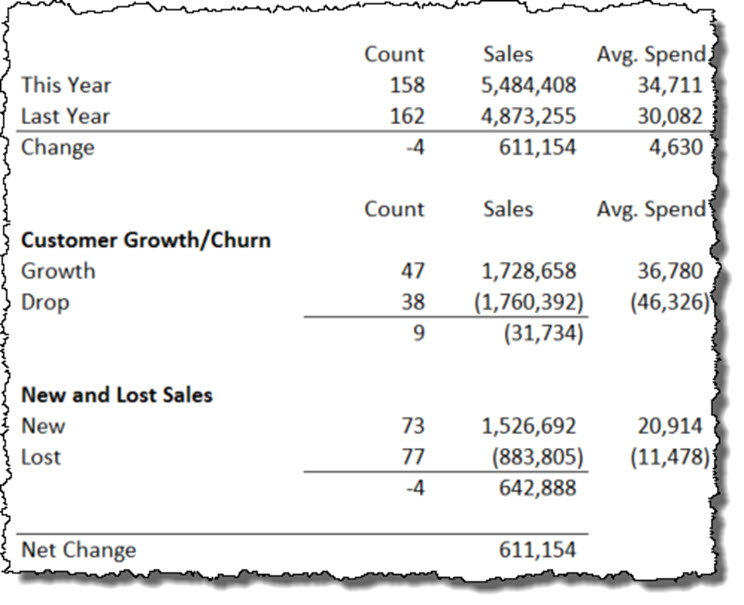
So let’s create the sales rollforward I mentioned above. Again, this is not a how-to, but rather a here-it-is-take-a-look:
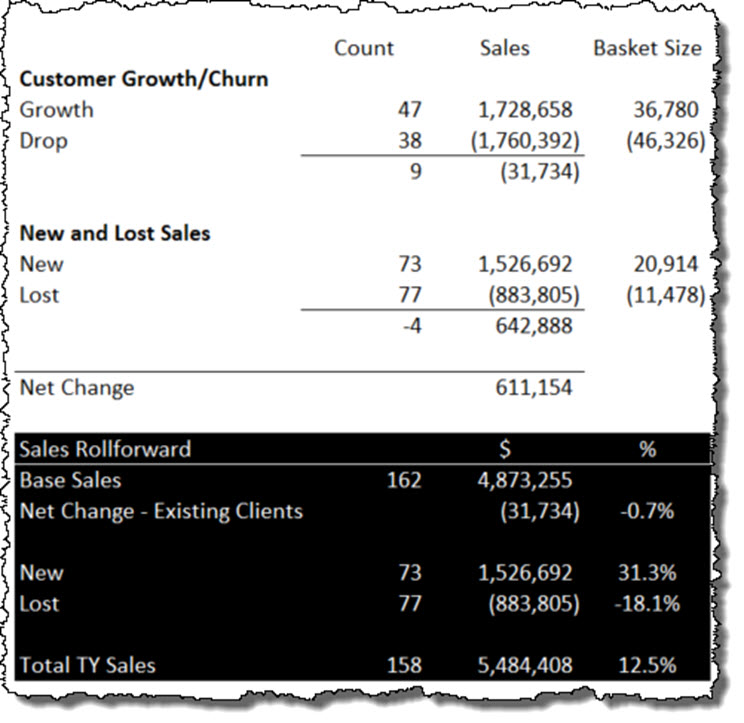
Your client is beaming with pride since sales have gone up 12.5%. But when you ask them how, you get a blank look and then, “Well, we just worked harder, Mark, it was a good year.”
All is good until you tell them:
- 38 clients downgraded by the tune of nearly $1.8 million which absorbed upgrades from existing clients
- 77 clients dropped off the face of the earth accounting for $883 thousand
- The sales growth was attributed to new sales from 73 clients of $1.5 million (which is probably not sustainable)
(Note: I’m using the term downgraded for simplicity and brevity. We use downgrades in the SaaS world, but this could easily be a drop in the services or products the clients are buying from the company you are analyzing).
So not all is well in paradise. We have new insights, and now we can help our client develop a few strategies to fix the downgrades and churn problems.
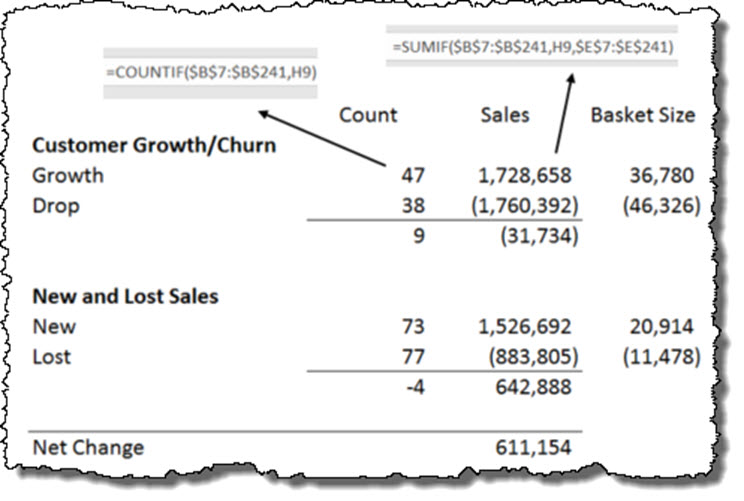
On a side note, I used countif and sumif functions to create the table above. Here’s a peek into my worksheet (nothing fancy, just the bare basics):
Step 5, Asking the Strategic Questions
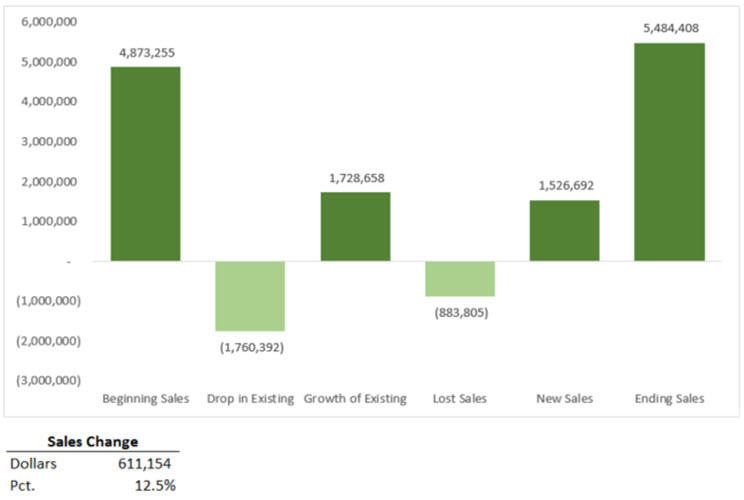
For you visual wizards, I’ve added a graphical, sales rollforward. I ditched the waterfall chart as I didn’t like the look of it, but it’s your client, your analysis–do what makes sense in your situation.
Once I get to this point with my client, I go over a few critical questions. By all means, use these or tweak them to your situation:
- What is the real reason our clients are buying from us?
- Why do they need us in the first place? What job is our service providing for them?
- Why do they go through us instead of a competitor?
- Why are we losing clients and what’s driving the downgrades?
In short, what should be happening? What’s happening instead? What are we learning? What are we going to do moving forward?
Get the answers nailed down, and your client has easily 10x’d their investment in you.
The Sales Rollforward is Merely a Starting Point
Want to know one of the main reasons I started doing the sales rollforward? Concentration of risk.
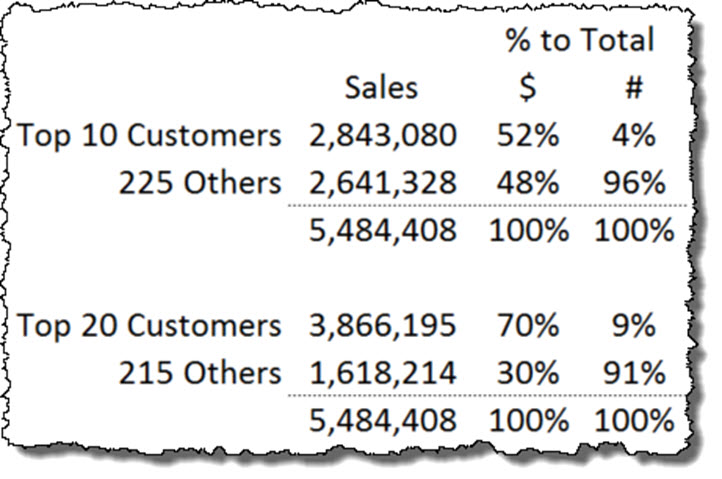
While the focus has been on the sales rollforward, be sure you include what percentage of the business is driven by the client’s top customers. The results will either reveal a sellable business or a non-sellable one with a very small margin of error. This company is flirting with disaster:
I also use the same framework to drop in Gross Profit and Contribution Margin if the data exists. For more data-advanced clients you will probably have access to it.
In the case of Gross Profit, I always do a scatterplot where sales is on my x-axis and gross margin is on the y-axis. This is the perfect visual for identifying the client’s desired client:
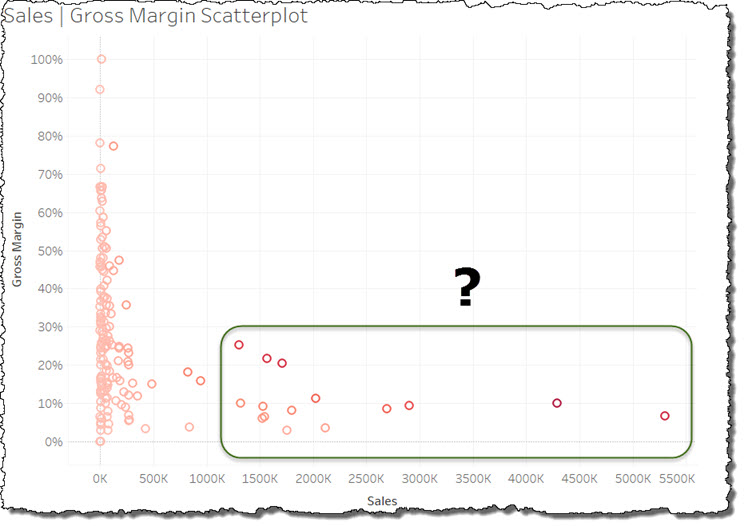
And it goes without saying, you can drill down to sales at the customer level looking for anomalies and other irregularities for customers that are downgrading or leaving you altogether:
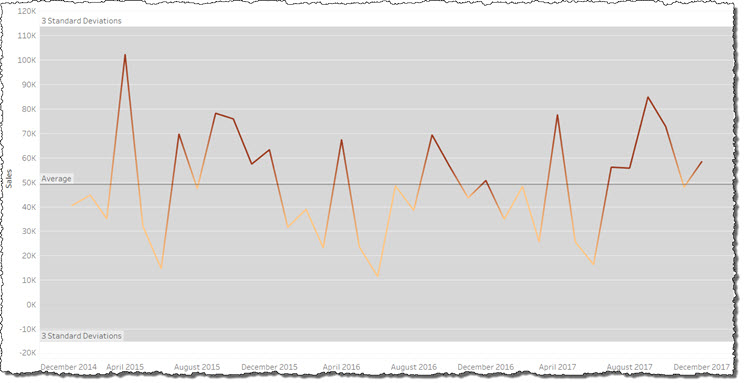
But now I’m getting off topic. The main thing is the sales rollforward. Also, you can use this framework for:
- Sales reps
- Vendors
- Product lines
- Customer segments
- Store unit sales for retailers, c-stores, or QSRs
Your only limitation is the data you have access to. And here’s the good part–this is easy work, but the end results can turn a business around quickly with the right coaching and mentoring.
Now it’s your turn. I only ask that you 10x what I’ve done above for your clients.